2019 Automotive Reputation Report
Reputation Staff Writer

Executive Summary
Maintaining a competitive advantage against the backdrop of ever-changing online customer sentiment requires constant vigilance: Dealers must tune into customer feedback and use it to continually improve operations and the customer experience, or watch their ratings and reviews tank.
Over the past several years, the automotive industry has made a real effort to manage online customer sentiment, and it has had a real impact. Our research shows that when they listen to and act on online consumer feedback, they are rewarded with more reviews, better online sentiment and more engagement. This data is the foundation of the Reputation Score and has a direct link to revenue.
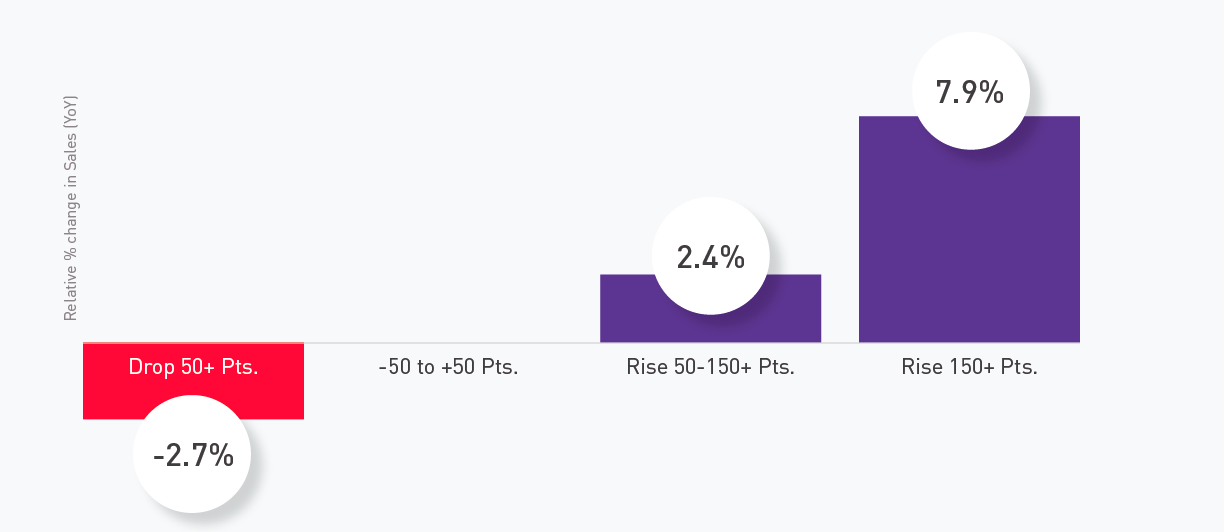
Our research revealed that a higher Reputation Score results in higher sales: Dealers see approximately 1% increase in sales for every 30-40 point increase in Reputation Score — up to a 10% difference between dealerships that are effectively managing their reputations and those that aren’t.
The 2019 Auto Reputation Report provides OEM brands with detailed insights into their dealerships’ strengths and weaknesses, uncovering opportunities for operational improvements based on insights from analyzing unstructured data in customer reviews, social media comments, surveys and more.
The Auto Industry Leads in Reputation Score, but Risks Exist for Brands and Dealerships
With its incredible growth over the last century and its millions-strong workforce around the world, the auto industry is a major player in the global economy.
Automotive has a long history of transformation through technological advancements. Now more than ever, the industry is faced with the need to keep up and gain a competitive advantage in the digital space. This requires that OEM brands and tier 3 retail dealers adapt to the preferred ways customers now search and shop for cars. Online reviews, business listings and social media now play a much larger role in the research that goes into a customer’s decision about where to purchase a car or service their vehicles.
Maintaining a competitive advantage against this backdrop of ever-changing online customer sentiment requires constant vigilance: Dealers must tune into customer feedback and use it to continually improve operations and the customer experience — or watch their ratings and reviews tank.
Over the past several years, those in the automotive industry have made a real effort to manage online customer sentiment, and it shows in the dealership’s and OEM brand’s Reputation Score — a comprehensive index of their online presence. They see that, when they listen to and act on online consumer feedback, they are rewarded with more reviews, better online sentiment and more engagement. Ultimately, this data is the foundation of the Reputation Score and has a direct link to revenue.
Reputation Score is a vital measurement for Hendrick Automotive Group that’s discussed weekly in direct calls between every General Manager and our Executive team. The reputation of our dealerships reflects on Mr. Hendrick himself and on our brand.
Using the Reputation.com platform, we can monitor Reputation Score for each dealership and for the organization as a whole, drill down into the specifics for unprecedented insight into the service we’re delivering, and take immediate action on what we learn. That helps us continue to improve the customer experience and inspire customer loyalty and advocacy in the communities we serve.
Ed Brown
CEO, Hendrick Automotive Group
Reputation Score to Sales Volume
Average Sales Volume Change
Score Change vs. Similar Dealers.
Based on aggregate ROI studies of some of the major OEMs.
Why This Report Matters
The 2019 Auto Reputation Report provides OEM brands with detailed insights into their dealerships’ strengths and weaknesses, uncovering opportunities for operational improvements based on insights from analyzing unstructured data in customer reviews, social media comments, surveys and more. This report reveals which auto brands and dealerships lead the pack on key dimensions of the auto-buying experience — as expressed in the unfiltered voice of the customer. The findings underscore the importance of reputation management as a key element of a dealership’s consumer experience strategy.
This report covers:
- How an increase in a dealership’s Reputation Score translates to increases in sales
- The relationship between online review factors and Reputation Score
- Specific reviews and ratings reflecting consumer sentiment of top auto brands’ dealerships based on their experience with sales, service and a variety of other categories
- The importance of reputation management as a core element of a dealership’s customer experience strategy
While automotive represents the highest overall Reputation Score as an industry, many challenges are presented for each operating store location — on a daily basis.
With 95% of vehicle buyers using digital sources to conduct research and 60% of automotive-related searches happening on a mobile device, it is critical that you manage the experience customers have with your brand at each point throughout their purchase journey. Proactive communication is how to win business in the digital age and lack of engagement with consumers on social channels and search engines may lead them to consider a competing dealer with better reviews and responses.
— The auto dealer’s guide to moving metal in a digital world
Dispelling the Myth
With the data from this report, OEM brands and their dealerships are better positioned to bridge the gap between automotive marketing and customer experience. They can listen, understand and act on all feedback channels, manage and address their online reputation, analyze consumer feedback to improve operations and processes, and increase consumer engagement. This information enables dealers to implement corrective actions where appropriate to drive increased sales and profits, as well as standardize processes based on what’s working well across their locations.
One of the most surprising findings of our report?
Our findings dispel the myth of the cliché “car salesman.” In fact, auto dealerships have better overall customer sentiment and higher Reputation Scores than the other major industries Reputation.com examined. In particular, auto dealers have higher average online sentiment and are among the most responsive to online feedback.
Although auto has done a decent job as an industry, dealers and OEM brands shouldn’t become complacent.
Reputation Scores can change quickly in the Feedback Economy, so consistent monitoring, responding and engagement are essential to successfully maintain a presence with consumers and proactively mitigate potential problems.
Significant revenue benefits are associated with a higher Reputation Score, meaning dealerships who invest in regularly monitoring and optimizing the experience at each touchpoint along the customer journey gain the strongest advantage.
Automotive vs. Other Industries
Automotive has the highest average online sentiment, and is most responsive to online feedback.
| Industry | Reputation Score | Star Rating Last 12 months | Reviews per Location Last 12 months | Response Rate to Negative Feedback |
| Auto Dealers | 607 | 4.4 | 263 | 69% |
| Hospitality | 605 | 4.2 | 609 | 23% |
| Dining | 584 | 4.0 | 444 | 66% |
| Real Estate | 571 | 4.0 | 45 | 70% |
| Retail | 552 | 4.2 | 254 | 9% |
| Healthcare | 401 | 3.6 | 14 | 48% |
| Finance | 367 | 3.0 | 5 | 15% |
Scope of Analysis
Reputation.com analyzed online data covering more than 16,000 dealerships in the United States from reviews, listings, social media, search results, and customer engagements from sources such as Google, Facebook, Cars.com, Edmunds and other sources. By leveraging Reputation.com’s proprietary machine learning algorithms and natural-language processing technology, we drilled into the actual customer feedback to understand what auto consumers are focused on and their overall sentiment. We separated the dealership feedback into overall, sales-specific and service-specific to understand consumer sentiment around each.
COVERING MORE THAN 16,000 DEALERSHIPS
IN THE UNITED STATES
What’s Your Reputation Score?
Measured on a scale of 0 to 1,000, Reputation.com’s Reputation Score is a comprehensive index of the digital presence of business locations in more than 70 industries. It is calculated based on multiple factors measuring overall review sentiment across review sites, business listings accuracy and other indicators that reflect the consumers’ car-buying experiences and opinions about dealerships — online and onsite.
The Reputation Score is comprised of nine elements:
Each element has internal factors that are calibrated independently (e.g. more recent and prominent reviews have a greater impact on star averages than older reviews). Once each of these measurements are calibrated, the overall Reputation Score is calculated.
In the auto industry, Reputation Score is the most comprehensive measure of a dealership’s online reputation, helping OEM brands and retail dealer locations determine where improvements must be made.
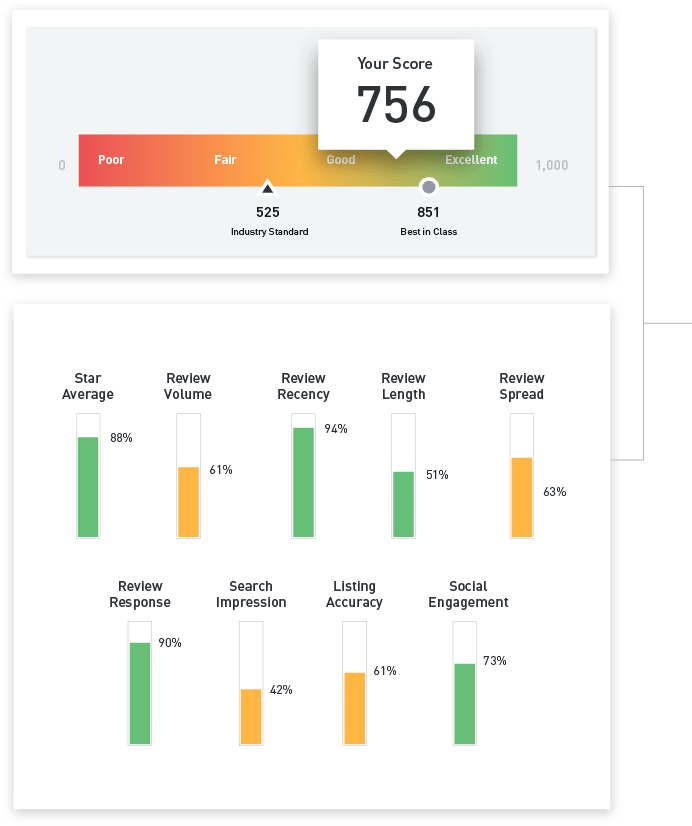
Auto dealerships must look into their overall Reputation Score to ensure they’re paying attention to all the factors that comprise it.
Key Findings
The following tables show the 28 largest OEM brands ranked by Reputation Score. Highlights include:
- Lexus has the highest average Reputation Score, along with the most consistent retail dealer body of locations pushing Reputation Scores above 700.
- Lincoln is generating the most favorable consumer sentiment within the industry.
- Consumer review volumes are the greatest for Toyota retail dealers amongst all OEM brands.
- Tesla had the poorest response rate to consumer reviews.
- Top dealer groups include AutoNation, Hendrick Automotive, and Ford and Lincoln. They represent 40% of the top 100 dealerships.
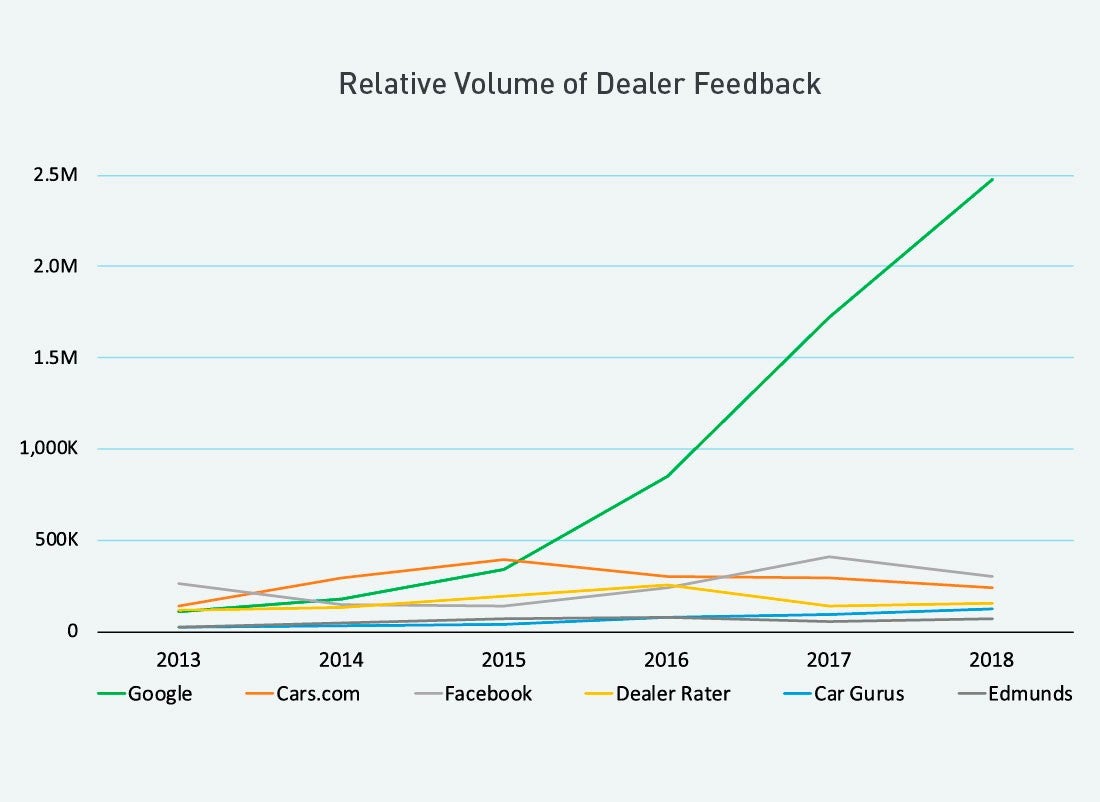
- It is well known that Google is the leader in search. Our findings conclude Google also dominates in online review volume, further reinforcing the need for brands and dealers to become committed to managing their online reputation.
Reputation Scores for Largest U.S. Brands
Reputation Scores for Largest U.S. Brands
Scores can be analyzed down to the retail dealership level, meaning the largest opportunity for OEMs, brands and dealers is to work collectively to improve reputation management efforts at each location.
| Brand | Average Reputation Score per Dealership | Reviews per Locations (Last 12 Months) | Average Location Rating (Last 12 Months) | Recent Response Rate (Negative Feedback) |
| Lexus | 672 | 311 | 4.49 | 48% |
| Nissan | 663 | 353 | 4.38 | 55% |
| Acura | 654 | 222 | 4.47 | 46% |
| Subaru | 647 | 269 | 4.43 | 56% |
| Lincoln | 642 | 168 | 4.45 | 40% |
| BMW | 641 | 284 | 4.42 | 48% |
| Buick | 639 | 153 | 4.35 | 52% |
| Toyota | 630 | 423 | 4.38 | 50% |
| Mercedes-Benz | 628 | 260 | 4.41 | 47% |
| Chevrolet | 627 | 180 | 4.32 | 47% |
| Ford | 617 | 213 | 4.35 | 42% |
| Kia | 613 | 226 | 4.24 | 39% |
| GMC | 612 | 119 | 4.3 | 48% |
| Audi | 612 | 180 | 4.39 | 43% |
| Honda | 604 | 321 | 4.37 | 40% |
| Infiniti | 602 | 164 | 4.39 | 40% |
| Ram | 593 | 286 | 4.2 | 46% |
| Jeep | 584 | 244 | 4.21 | 40% |
| Volkswagen | 582 | 164 | 4.25 | 41% |
| Dodge | 581 | 239 | 4.21 | 40% |
| Chrysler | 580 | 238 | 4.21 | 40% |
| Mazda | 573 | 135 | 4.3 | 37% |
| Cadillac | 572 | 108 | 4.34 | 57% |
| Hyundai | 565 | 193 | 4.26 | 38% |
| Land Rover | 561 | 102 | 4.27 | 48% |
| Volvo | 550 | 85 | 4.3 | 35% |
| Tesla | 549 | 96 | 4.47 | 1% |
| Mitsubishi | 512 | 108 | 4.11 | 24% |
Data Factored to get the Reputation Score
Many factors go into the Reputation Score, including listings accuracy, social sentiment and search impressions.
| Brand | Visibility Score | Engagement Score | Sentiment Score | Locations w/ Score <500 | Locations w/ Score >700 |
| Lexus | 65% | 68% | 79% | 8% | 49% |
| Nissan | 70% | 72% | 72% | 6% | 38% |
| Acura | 61% | 64% | 76% | 12% | 39% |
| Subaru | 66% | 74% | 73% | 10% | 36% |
| Lincoln | 58% | 65% | 79% | 15% | 43% |
| BMW | 63% | 66% | 74% | 11% | 33% |
| Buick | 60% | 71% | 74% | 11% | 33% |
| Toyota | 65% | 66% | 71% | 14% | 32% |
| Mercedes-Benz | 63% | 66% | 73% | 14% | 34% |
| Chevrolet | 59% | 66% | 73% | 13% | 30% |
| Ford | 59% | 64% | 73% | 19% | 32% |
| Kia | 62% | 56% | 69% | 14% | 23% |
| GMC | 54% | 67% | 74% | 17% | 27% |
| Audi | 56% | 63% | 74% | 19% | 33% |
| Honda | 59% | 58% | 71% | 19% | 27% |
| Infiniti | 56% | 62% | 72% | 18% | 29% |
| Ram | 64% | 64% | 65% | 18% | 17% |
| Jeep | 60% | 59% | 66% | 20% | 16% |
| Volkswagen | 56% | 58% | 68% | 22% | 20% |
| Dodge | 59% | 59% | 66% | 21% | 16% |
| Chrysler | 59% | 58% | 66% | 21% | 16% |
| Mazda | 51% | 56% | 71% | 26% | 20% |
| Cadillac | 49% | 77% | 75% | 27% | 25% |
| Hyundai | 54% | 56% | 68% | 28% | 21% |
| Land Rover | 49% | 65% | 70% | 29% | 18% |
| Volvo | 44% | 57% | 73% | 36% | 22% |
| Tesla | 44% | 3% | 76% | 31% | 7% |
| Mitsubishi | 46% | 42% | 66% | 43% | 11% |
Reputation Score Results
For the Top-Rated Large Dealer Groups and Top 100 Dealerships
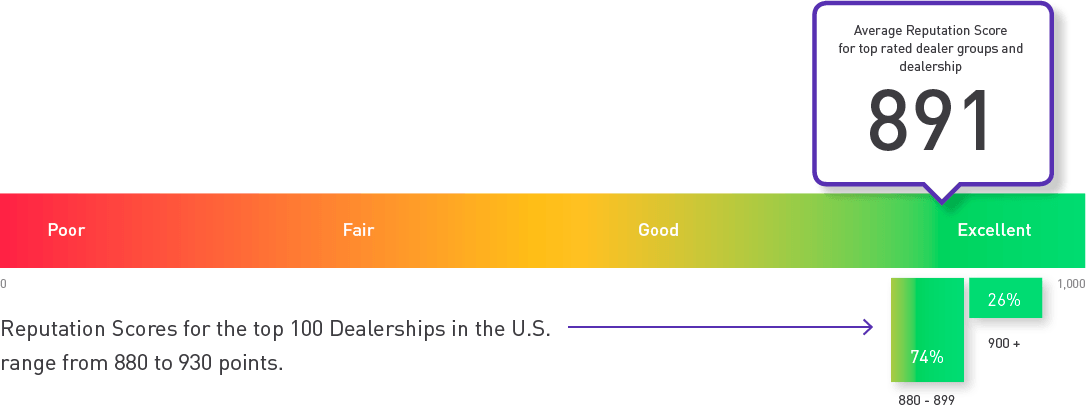
TOP RANKING
[widgetkit id=”1405″]
Reputation Scores for Large US Dealer Groups
ALL – (As of Q2 2019)
| Brand | Average Reputation Score per Dealership | Visibility Score | Engagement Score | Sentiment Score |
| Hendrick Automotive | 722 | 77% | 91% | 77% |
| AutoNation | 704 | 84% | 98% | 68% |
| Group1 | 696 | 77% | 89% | 72% |
| Sonic Automotive | 693 | 78% | 86% | 70% |
| Asbury Automotive Group | 673 | 77% | 95% | 64% |
| Penske | 656 | 63% | 83% | 76% |
| Lithia | 641 | 74% | 55% | 68% |
| Ken Garff Automotive | 638 | 69% | 82% | 65% |
| Larry H. Miller | 636 | 76% | 81% | 62% |
| Berkshire Hathaway Automotive | 618 | 67% | 67% | 69% |
| Greenway Automotive | 592 | 70% | 47% | 63% |
Reputation Scores for Publicly Held Large US Dealer Groups
(As of Q2 2019)
| Brand | Average Reputation Score per Dealership | Visibility Score | Engagement Score | Sentiment Score |
| AutoNation | 704 | 84% | 98% | 68% |
| Group1 | 696 | 77% | 89% | 72% |
| Sonic Automotive | 693 | 78% | 86% | 70% |
| Asbury Automotive Group | 673 | 77% | 95% | 64% |
| Penske | 656 | 63% | 83% | 76% |
| Lithia | 641 | 74% | 55% | 68% |
| Berkshire Hathaway Automotive | 618 | 67% | 67% | 69% |
Reputation Scores for Privately Held Large US Dealer Groups
ALL – (As of Q2 2019)
| Brand | Average Reputation Score per Dealership | Visibility Score | Engagement Score | Sentiment Score |
| Hendrick Automotive | 722 | 77% | 91% | 77% |
| Ken Garff Automotive | 638 | 69% | 82% | 65% |
| Larry H. Miller | 636 | 76% | 81% | 62% |
| Greenway Automotive | 592 | 70% | 47% | 63% |
Top 100 Dealerships
(As of Q2 2019)
| Dealership Name | City | State | Reputation Score |
| Hendrick Lexus Charlotte | Charlotte | NC | 930 |
| Gilbert & Baugh Ford, Inc. | Albertville | AL | 917 |
| Mazda City of Orange Park | Jacksonville | FL | 917 |
| Keller Bros. Ford Lebanon | Lebanon | PA | 913 |
| King Ford | Murphy | NC | 913 |
| Hendrick Lexus Northlake | Charlotte | NC | 910 |
| Friendly Ford | Geneva | NY | 910 |
| Porsche Riverside | Riverside | CA | 910 |
| Witt Lincoln | San Diego | CA | 910 |
| McKie Ford Lincoln | Rapid City | SD | 909 |
| Bob Boyd Lincoln | Columbus | OH | 908 |
| Metro Ford | Miami | FL | 907 |
| BMW of Catonsville | Catonsville | MD | 906 |
| Rusty Wallace Ford | Dandridge | TN | 906 |
| Leman’s Chevy City | Bloomington | IL | 906 |
| Bayou Ford | Laplace | LA | 905 |
| Smail Honda | Greensburg | PA | 905 |
| Bill Jacobs MINI | Naperville | IL | 905 |
| Brilliance Subaru | Elgin | IL | 905 |
| Hendrick Honda Bradenton | Bradenton | FL | 904 |
| Chastang Ford | Houston | TX | 904 |
| Lamoille Valley Ford | Hardwick | VT | 904 |
| Sykora Family Ford | West | TX | 903 |
| Mike Carpino Ford | Columbus | KS | 902 |
| Earl Duff Subaru | Harriman | TN | 900 |
| Hendrick Acura | Charlotte | NC | 900 |
| Nye Ford | Oneida | NY | 899 |
| Howard Bentley Buick GMC | Albertville | AL | 899 |
| Hendrick Lexus Kansas City | Merriam | KS | 898 |
| D’ELLA Honda of Glens Falls | Queensbury | NY | 898 |
| Bob Tomes Ford | Mckinney | TX | 897 |
| Autosaver Ford | Comstock | NY | 896 |
| AutoNation Lincoln Clearwater | Clearwater | FL | 896 |
| Libertyville Lincoln | Libertyville | IL | 896 |
| Shaker’s Family Ford Lincoln | Watertown | CT | 895 |
| Jack Kain Ford | Versailles | KY | 894 |
| Suburban Ford | Sandy | OR | 893 |
| Sunbury Motor Company | Sunbury | PA | 893 |
| Tom Peck Ford of Huntley | Huntley | IL | 892 |
| Miller Motor Sales Inc | Burlington | WI | 892 |
| Planet Hyundai | Golden | CO | 891 |
| Hendrickson Chrysler Dodge Jeep Ram | Monticello | IN | 890 |
| White Bear Mitsubishi | White Bear Lake | MN | 890 |
| Kimber Creek Ford | Pine River | MN | 889 |
| McCoy and Mills Ford | Fullerton | CA | 889 |
| Wagner Subaru | Fairborn | OH | 889 |
| Ray Dennison Chevrolet | Pekin | IL | 888 |
| Royal Nissan | Baton Rouge | LA | 888 |
| Heritage Toyota Owings Mills | Owings Mills | MD | 888 |
| Finnin Kia | Dubuque | IA | 888 |
| Heritage Mazda Bel Air | Bel Air | MD | 887 |
| Crown Nissan | St. Petersburg | FL | 887 |
| RBM of Alpharetta | Alpharetta | GA | 887 |
| Rick Ridings Ford | Monticello | IL | 887 |
| Courtesy Buick GMC | Louisville | KY | 887 |
| Doug’s Northwest Cadillac | Shoreline | WA | 887 |
| Garnet Ford | West Chester | PA | 886 |
| MINI of Charleston | Charleston | SC | 886 |
| George Coleman Ford | Travelers Rest | SC | 886 |
| Classic Cadillac | Mentor | OH | 886 |
| Terrebonne Ford Lincoln | Houma | LA | 885 |
| Parker Ford-Lincoln | Murray | KY | 885 |
| Flood Ford Lincoln | Narragansett | RI | 885 |
| Faulkner Volvo | Feasterville – Trevose | PA | 885 |
| Smail Acura | Greensburg | PA | 885 |
| O’Brien Nissan Of Bloomington | Bloomington | IL | 884 |
| MINI of Bedford | Bedford | NH | 884 |
| Golden Circle Ford-Lincoln | Jackson | TN | 884 |
| Sunnyside Chevrolet | Elyria | OH | 884 |
| Audi Temecula | Temecula | CA | 884 |
| Jim Ellis Hyundai | Atlanta | GA | 883 |
| Arundel Ford | Arundel | ME | 883 |
| Tamaroff Nissan | Southfield | MI | 883 |
| Hendrick Subaru Southpoint | Durham | NC | 883 |
| Hendrick Porsche | Charlotte | NC | 883 |
| Marlboro Nissan | Marlborough | MA | 883 |
| Bob Ruth Ford | Dillsburg | PA | 883 |
| Bill Colwell Ford Inc. | Hudson | IA | 883 |
| Handy Toyota | St Albans City | VT | 882 |
| Tom Gibbs Chevrolet | Palm Coast | FL | 882 |
| Honda of Lincoln | Lincoln | NE | 882 |
| Sullivan Honda | Torrington | CT | 882 |
| Sam Wampler’s Freedom Ford | Mcalester | OK | 882 |
| Butler Lexus | Macon | GA | 881 |
| Volvo Cars Mall of Georgia | Buford | GA | 881 |
| Lighthouse Buick GMC | Morton | IL | 881 |
| Seelye Kia of Kalamazoo | Kalamazoo | MI | 881 |
| Crown Acura | Clearwater | FL | 881 |
| BMW Southpoint | Durham | NC | 881 |
| John Lee Nissan | Panama City | FL | 881 |
| Crest Ford | Center Line | MI | 881 |
| Jaguar Palm Beach | West Palm Beach | FL | 881 |
| Riley Ford | Chazy | NY | 880 |
| DeVoe Cadillac | Naples | FL | 880 |
| Mainer Ford | Okarche | OK | 880 |
| Toyota of Wausau | Wausau | WI | 880 |
| Paoli Ford | Paoli | PA | 880 |
| Classic Hyundai | Mentor | OH | 880 |
| Flammer Ford of Spring Hill | Spring Hill | FL | 880 |
| Pauli Ford | Saint Johns | MI | 879 |
Leveraging Location-Level Feedback to Maximize the Value of your Reputation
In addition to providing brand feedback, Reputation Score provides insight at the location level and beyond.
Overall averages can mask poorly performing locations, but much of the underlying data exists at a dealership level, an OEM, regional manager, dealer group or individual dealership can see detailed insights about particular locations or departments in real time — to catch problems when they arise and address them.
At Sonic Automotive and at our dealerships we place significant importance and invest our efforts in managing our online customer reviews. We closely monitor and respond to all reviews, positive or negative. Daily reports are reviewed at all levels of our organization including by our CEO and President.
Rachel Richards
CMO, Sonic Automotive
For example, monitoring your Reputation Score in real time can help you identify:
- Which dealerships are seeing a drop in customer sentiment and why.
- When you have received negative feedback that needs to be addressed.
- Sites where your volume of customer feedback is lagging behind your competitors.
- When and where your listings data has become inaccurate.
- Which regions you are leading and lagging in local search, and which competitors are ahead of you.
Reputation Score Provides Location-Level Feedback
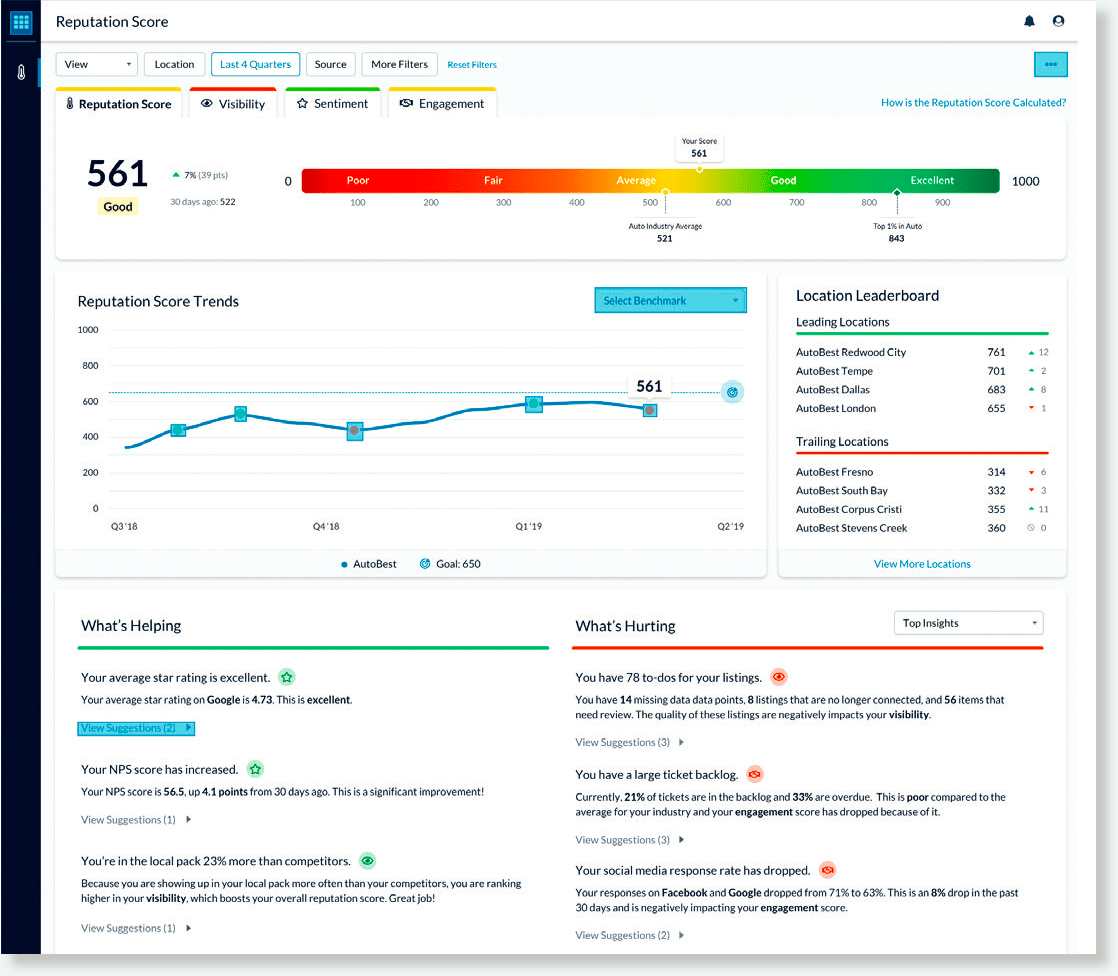
Locations, groups and OEM brands that manage their reputation across all touchpoints and all locations can ensure the highest overall score and maximize the entire impact of their reputation and how it drives customer visibility and satisfaction at every one of their dealerships.
Google, Facebook and dozens of other sites have become the go-to resources to get information about vehicles and auto dealers, which means your reputation is displayed prominently on the results pages of any search, whether you ask for it or not.
The nature of search engines and how they help consumers instantly gain answers is why you have to manage your online reputation.
Customers prefer to do business with the best. Having a high Reputation Score and ratings are essential to boost your visibility and how consumers perceive your dealership’s brand.
A solid strategy for improving and maintaining your online reputation has many components:
- Make sure that all review sites have correct and consistent information.
After all, that’s how car buyers find you. Plan quarterly, track monthly and monitor on a daily basis. - Build up a solid base of positive reviews.
Consistently increasing the volume of positive reviews offset existing negative reviews and show the true level of customer satisfaction. - Monitor and respond to reviews.
Being proactive on your company and social sites is how to demonstrate commitment to your customers, in order to build customer advocacy online. The unfiltered feedback collected from surveys provides valuable insights into what your dealership is doing well and where some improvements could be made. - Develop a social media strategy.
The best way to amplify your dealership and brand online is to get proactive on social media. Develop a strategy to publish consistently on sites like Facebook, Instagram and Twitter. Sharing positive customer feedback via social channels and your website is a final essential step.
Reputation management has always been a priority to our business, and continuing to lead within our industry is really a testament to each of our 26,000 associates who do everything to create a best-in-class experience for our customers.
Marc Cannon
EVP & CMO, AutoNation
A Deeper Dive Into Reputation Score Influencers
Let’s take a look at three of the main categories influencing Reputation Score — visibility, engagement and sentiment.
Visibility
Visibility refers to the dealership’s online presence, which includes business listings accuracy as well as the consumer’s ability to easily find reviews and feedback.
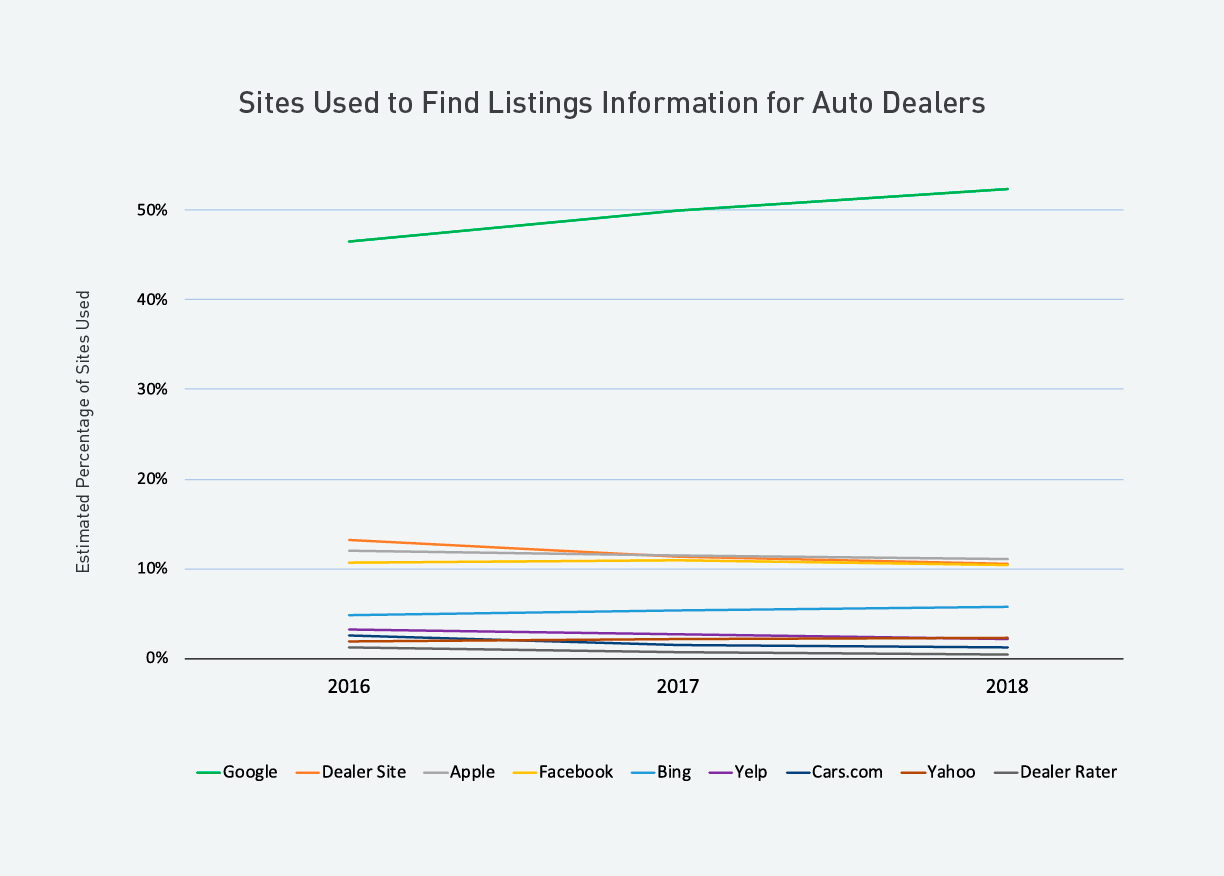
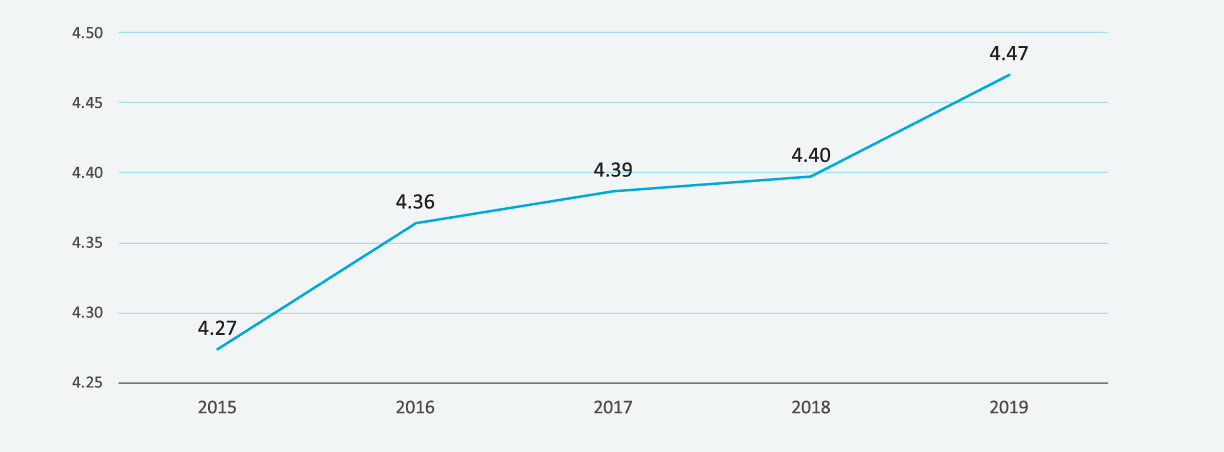
Google emerges as the primary source of information about dealership locations (e.g. where to find a dealership’s address, phone number, or business hours) — even more than the dealer sites or auto industry-specific sites like Cars.com and Car Gurus. Over the past three years, Google has also dominated in user feedback. While Google star ratings are only one element influencing Reputation Score, they feature prominently on search results and are therefore a key factor in driving consumer choices.
Engagement
Engaging with customers throughout the customer journey drives new content, higher search rankings and greater customer satisfaction. Responding to reviews is no different.
In fact, 75% of consumers expect a consistent experience wherever they engage with a business — both online and offline. That certainly also holds true for the automotive industry.
Dealerships that respond to all negative reviews and the majority of overall reviews have significantly higher sentiment, more reviews, better search rankings, higher Reputation Scores and higher sales volume.
Sentiment
Sentiment refers to the actual consumer feelings about a brand, typically found in written reviews and social media discussions.
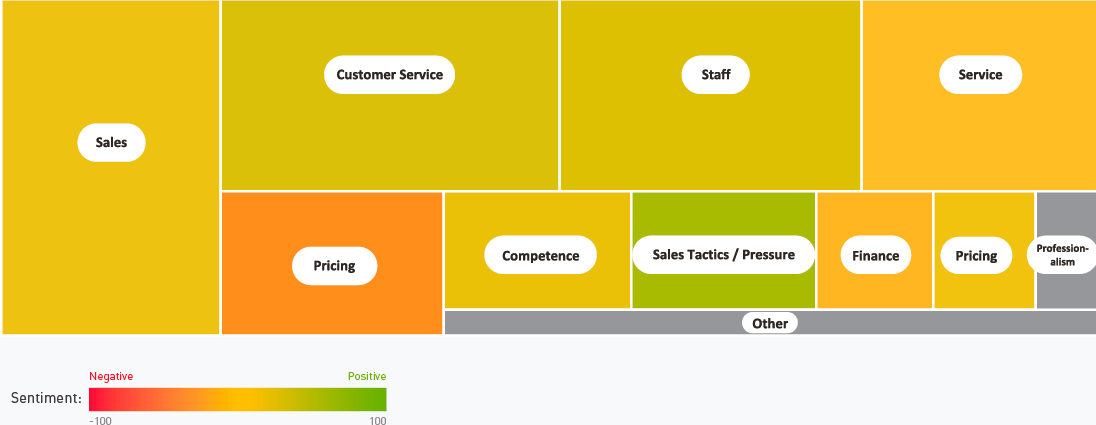
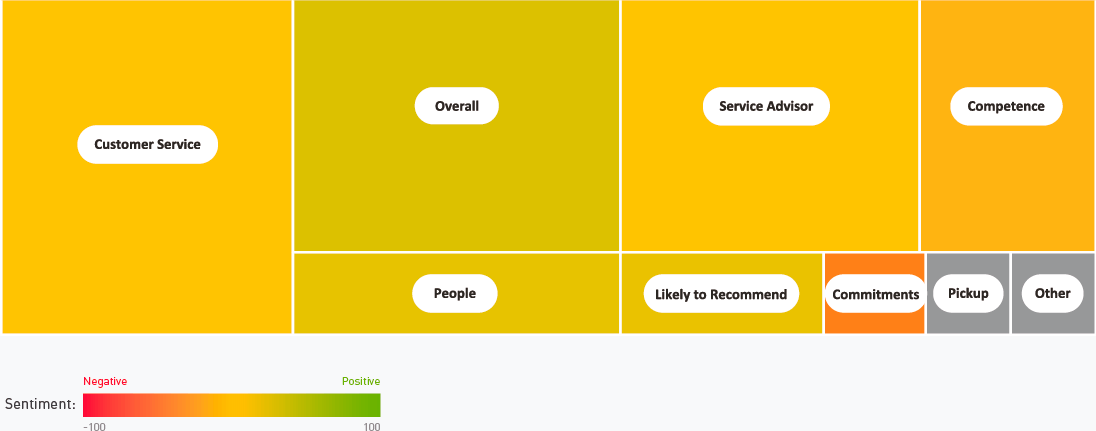
The first chart illustrates the overall consumer sentiment for the top dealerships. The second chart illustrates the same for dealerships with a lower Reputation Score. Here, we see many more complaints around sales, service and pricing for lower-ranked dealerships.
Consumer Sentiment for The Top Dealerships

Consumer Sentiment for Dealerships With Lower Reputation Scores
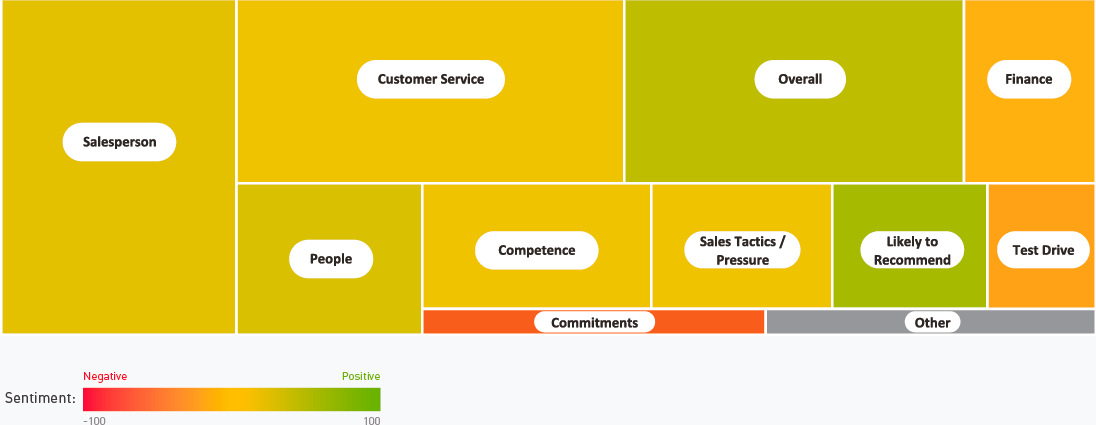
The following charts compare feedback for the top and bottom dealerships in the category of sales.
The number of complaints for dealerships with lower Reputation Scores is much greater, and centers on the salesperson and customer service, financing, issues related to test drives and honoring commitments.
Feedback for The Top Dealerships in The Category of Sales

Feedback for The Bottom Dealerships in The Category of Sales
These charts compare feedback for the top and bottom dealerships on service.
A similar theme emerges: The lower-ranked dealerships received more complaints around service advisors, and customer service, as well as competence and honoring commitments.
Feedback for the Top Dealerships in the Category of Service

Feedback for the Bottom Dealerships in the Category of Service
Comparison of Ratings for the Location on Different Sources
| Cars.com | Dealer Rater | Car Gurus | Edmunds | ||
| 4.4 | 4.65 | 4.37 | 4.76 | 4.21 | 4.73 |
Average Google Rating Over Time
Brand-Level Customer Feedback
The following charts show the top five OEM brands’ actual rankings in eight categories — Sales, Service, Speed, Pricing, Salesperson, Sales Competence, Service Advisor and Service Competence/Quality — based upon an analysis of all of the online feedback we gathered through 2018.
Each brand was measured on a scale of 1 to 5 in each category (1 being the lowest and 5 the highest).
Sales
| Brand | Category NPS | Associated Rating |
| Subaru | 71% | 4.5 |
| Lexus | 68% | 4.5 |
| Lincoln | 66% | 4.4 |
| Mazda | 65% | 4.4 |
| Honda | 65% | 4.4 |
The Sales category refers to the actual car-buying experience, from initial greeting through test drive and out the door. Subaru and Lexus tied for the top spot with a 4.5 ranking for each. The others — Lincoln, Mazda and Honda — all tied for second place with a rating not far behind, at 4.4.
Service
| Brand | Category NPS | Associated Rating |
| Lexus | 49% | 4.3 |
| Acura | 48% | 4.3 |
| Infiniti | 44% | 4.2 |
| Volvo | 43% | 4.1 |
| Audi | 40% | 4.1 |
Service relates to any service maintenance experience, such as an oil change, tire rotation, tune-up, and so on. In this category, Acura bested Subaru to join Lexus at the top with a 4.3 rating. Infiniti came in at No. 2 with a 4.2 rating, and Volvo and Audi tied for third with 4.1 each.
Speed
| Brand | Category NPS | Associated Rating |
| Subaru | 71% | 4.5 |
| Lexus | 68% | 4.5 |
| Lincoln | 66% | 4.4 |
| Mazda | 65% | 4.4 |
| Honda | 65% | 4.4 |
Ironically, Speed in the automotive report has nothing to do with how fast any of these cars can go. Rather, Speed refers to the speed of service delivery, such as wait times and representative availability at dealerships. In this category, Lexus again emerged at the top with a 4.6 rating. Acura and Subaru followed close behind with ratings of 4.5. Honda and Toyota rolled in at 4.4.
Pricing
| Brand | Category NPS | Associated Rating |
| Subaru | 32% | 4 |
| Mazda | 27% | 3.9 |
| Acura | 26% | 3.9 |
| Lexus | 24% | 3.8 |
| Honda | 23% | 3.8 |
The Pricing category relates to pricing fairness, including terms and competitiveness of rates and optional services. It also includes the payment experience. Interestingly, this category logged the lowest scores. Subaru came in at 4.0, Mazda and Acura at 3.9, and Lexus and Honda at 3.8.
Salesperson
| Brand | Category NPS | Associated Rating |
| Subaru | 68% | 4.5 |
| Lincoln | 66% | 4.4 |
| Lexus | 66% | 4.4 |
| Ford | 64% | 4.3 |
| Acura | 63% | 4.3 |
Employees’ attitudes and demeanor often make all the difference in positive online ratings and reviews. The Salesperson category attempted to quantify this. Here, Subaru claimed the top spot with a 4.5 rating. Lincoln and Lexus came in at 4.4 each, and Ford and Acura rounded out the top five with ratings of 4.3.
Sales Competence
| Brand | Category NPS | Associated Rating |
| Subaru | 77% | 4.7 |
| Lexus | 76% | 4.6 |
| Acura | 75% | 4.7 |
| Honda | 73% | 4.6 |
| Mazda | 73% | 4.6 |
The Sales Competence category relates to how informed and prepared a dealership’s sales representatives are to answer customer questions. Subaru and Acura each rated a 4.7, and Lexus, Honda and Mazda came in with ratings of 4.6.
Service Advisor
| Brand | Category NPS | Associated Rating |
| Lexus | 60% | 4.3 |
| Acura | 56% | 4.2 |
| Volvo | 53% | 4.1 |
| Mercedes-Benz | 50% | 4 |
| Honda | 49% | 4 |
A service advisor is the liaison between the customer and the service technicians at a dealership. In this category, Lexus earned the top spot with a rating of 4.3. Acura and Volvo came in second and third, with ratings of 4.2 and 4.1, respectively. Mercedes-Benz debuted in the top five in this category with a rating of 4.0, as did Honda.
Service Competence/Quality
| Brand | Category NPS | Associated Rating |
| Acura | 59% | 4.5 |
| Lexus | 59% | 4.4 |
| Infiniti | 52% | 4.2 |
| Volvo | 52% | 4.2 |
| Honda | 50% | 4.2 |
Service Competence/Quality refers to the quality of work performed in the service department. Acura and Lexus claim the top two spots with ratings of 4.5 and 4.4, respectively. Infiniti, Volvo and Honda all clock in with 4.2 each.
Final Thoughts
In terms of reputation management, the auto industry has done well — better than any other industry we’ve focused on to date. But that’s not a sign that dealerships can rest on their laurels. With the revenue benefits associated with a higher Reputation Score and customer sentiment always changing, dealerships should regularly monitor every touchpoint on the customer journey to make sure nothing is overlooked that could negatively affect the customer experience. A reputation management platform can help here to identify potential issues and ensure you’re covering all your bases. In fact, more than one-third of dealers in the United States now use Reputation.com’s state-of-the-art technology platform and managed services to better attract and engage customers, drive traffic and increase revenue. Find out how you can better manage online customer reviews and increase sales with Reputation.com.
As evident in the findings of this report, brands that are proactively managing online reputation and the customer experience connect with more customers. Your Reputation Score is a window into where your organization is excelling and where issues or opportunities exist. There is tremendous room for brands and dealers to improve overall ratings, as well as drive more traffic and actions such as click-to-call, click for driving directions and scheduling appointments — ultimately resulting in more visits and higher sales.
